Implied volatility (IV) is the price the market puts on uncertainty. When it jumps in a day, traders are paying more for options on that stock. The reason might be an earnings report, a regulatory decision, a rumor, or nothing anyone can name yet. A scanner can show you where IV moved. It can't tell you why, so the useful skill is triage. This guide shows how to read Mboum's IV change scanner and how to separate spikes worth a closer look from noise.
What the scanner shows
Open Implied Volatility Percent Change. It lists stock option contracts whose IV changed the most since the previous session. Contracts must have traded in the last two days, expire in 15 days or more, and have a last price of at least $0.10, volume of at least 500 contracts and open interest of at least 100. The page says it plainly: a change in IV reflects a change in what options are pricing, not which way the stock will move.
- Direction: Increases lists contracts whose IV rose more than 10%. Decreases lists contracts whose IV fell.
- IV % Change: minimum size of the move, from Up more than 35% to Up more than 90%, or Down more than 10% to Down more than 75%.
- Stock Price: Any, or bands from Under $10 to Over $200.
- Columns: Symbol, Type, Strike, Expiration, DTE, Stock Price, IV % Change, IV, Bid, Ask, Last, Volume, Open Interest, Delta and Last Trade.
Filters need a free Mboum account.
Three real rows from Nov 11, 2026
These were the first rows in the Increases list. They change through the day, so treat them as a snapshot.
- GLAS call, $3.00 strike, Jan 2028: IV +150.65% to 246.94%. Bid $0.05, ask $2.95, last $0.57.
- HTZ call, $1.00 strike, Jan 2027: IV +111.21% to 145.50%. Bid $0.59, ask $0.83. Volume 575, open interest 1,784.
- RCAT put, $5.00 strike, Apr 2027: IV +89.04% to 97.43%. Bid $1.45, ask $1.50. Volume 657, open interest 6,129.
All three have big IV jumps. They are not equally trustworthy. The GLAS bid and ask are $2.90 apart on a contract that last traded at $0.57, so the IV calculated from that market is shaky. HTZ has a spread of $0.24 on a $0.71 midpoint, about 34%. RCAT is quoted $0.05 wide and has the most open interest of the three. If you could only look into one, RCAT has the cleanest market.
A triage checklist for an IV spike
- Is the quote tight? Divide the spread by the midpoint. A spread of 30% or more means the IV number rests on a poor market.
- Is it traded? Compare volume with open interest. Volume near or above open interest means new activity, not a stale quote.
- Is the contract informative? A deep in-the-money contract is mostly stock value, so its IV tells you less than an at-the-money contract. Check the delta column.
- Is there a reason you can see? Check the Upcoming Earnings page for a report date and the news page for headlines. Mboum does not track regulatory decision dates, so check the company's own announcements for those.
- What is the move against? IV % Change is against the previous session, so a spike from a very low base can look dramatic. Compare IV with the stock's own past year on the Implied Volatility Rank page.
After a known event passes, IV usually drops. The Decreases direction shows contracts where that has already happened. Buying options after a spike means paying a price that already includes the uncertainty.
Get this as JSON
GET https://api.mboum.com/v1/markets/options/iv-change has weight 2. Parameters: type (required), direction (UP by default, or DOWN), price_min and page. Each page holds 20 contracts. Results always cover stock options. See the endpoint docs.
The script below applies the first checklist items, then looks up the next earnings date for each survivor with GET /v2/markets/calendar/earnings (weight 2 per symbol; docs).
import requests

BASE = "https://api.mboum.com"
HEADERS = {"Authorization": "Bearer YOUR_MBOUM_API_KEY"}


def num(value):
    return float(str(value).replace(",", "").replace("%", "").replace("+", ""))


def get(path, **params):
    resp = requests.get(BASE + path, headers=HEADERS, params=params, timeout=30)
    data = resp.json()
    body = data.get("body")
    if resp.status_code != 200 or not isinstance(body, list) or not body:
        print(f"{path} returned no rows: {str(data)[:120]}")
        return []
    return body


def spread_pct(row):
    bid, ask = num(row["bidPrice"]), num(row["askPrice"])
    return (ask - bid) / ((ask + bid) / 2) * 100 if ask + bid > 0 else 999


def triage(rows, min_change=50, max_spread=30):
    return [r for r in rows
            if num(r["volatilityPercentChange"]) >= min_change
            and spread_pct(r) <= max_spread]


earnings_cache = {}


def next_earnings(symbol):
    if symbol not in earnings_cache:
        rows = get("/v2/markets/calendar/earnings", ticker=symbol)
        earnings_cache[symbol] = rows[0].get("nextEarningsDate", "none listed") if rows else "none listed"
    return earnings_cache[symbol]


if __name__ == "__main__":
    rows = get("/v1/markets/options/iv-change", type="STOCKS", direction="UP")
    for r in triage(rows)[:5]:
        print(r["baseSymbol"], r["symbolType"], r["strikePrice"], f"{r['daysToExpiration']}d",
              "IV change", r["volatilityPercentChange"], "IV", r["volatility"],
              f"spread {spread_pct(r):.0f}%", f"vol {r['volume']} / OI {r['openInterest']}",
              "next earnings", next_earnings(r["baseSymbol"]))
Applied to the three rows above, the 30% spread cutoff keeps RCAT and drops GLAS and HTZ. One run costs 2 for the list plus 2 for each distinct symbol checked, at most 12 here.
Sample response
A trimmed row from the docs example, with the fields the script reads:
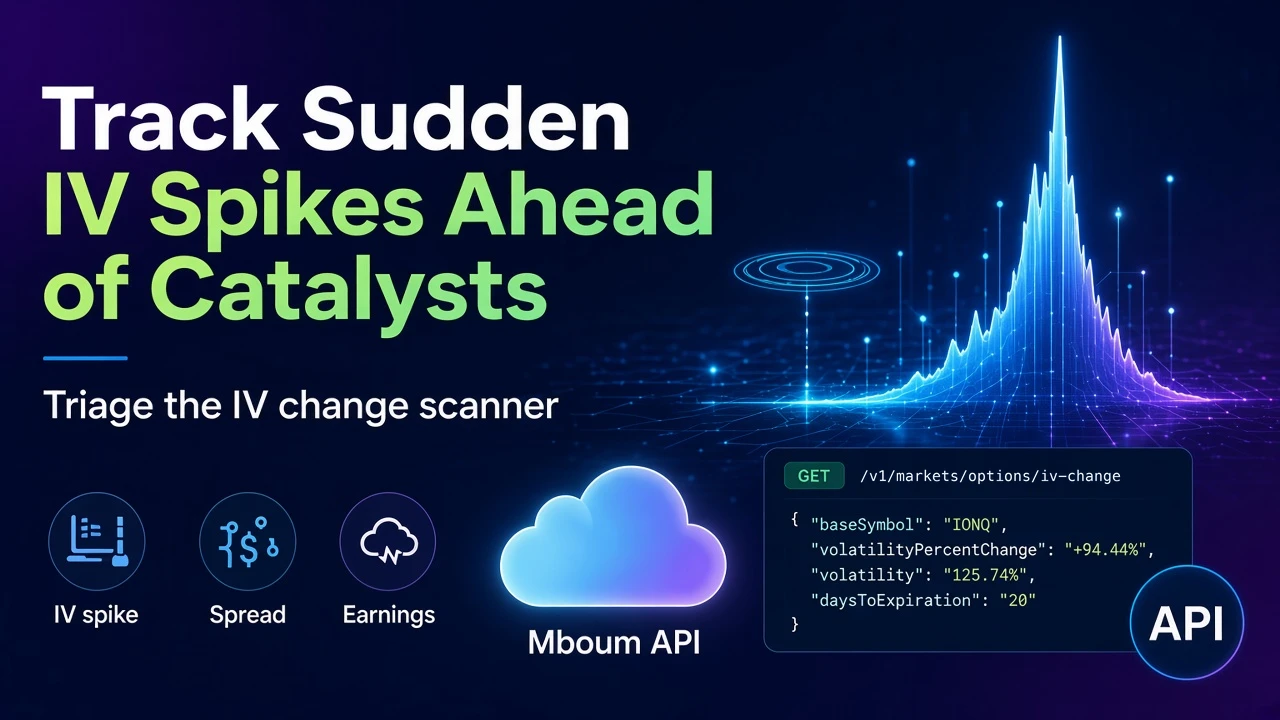
{
  "baseSymbol": "IONQ",
  "symbolType": "Call",
  "strikePrice": "8.00",
  "daysToExpiration": "20",
  "bidPrice": "1.23",
  "askPrice": "2.12",
  "volume": "779",
  "openInterest": "302",
  "volatilityPercentChange": "+94.44%",
  "volatility": "125.74%"
}
This row would not pass the spread check: $0.89 wide on a $1.68 midpoint is about 53%.
Best practices
- Check the body. A 200 response can carry an error message and no
bodylist. The script prints it and continues with no rows. - Parse the strings. Values such as
"+94.44%"and"3,387"need cleaning before you do math. - Mind the rate limit. The limit is 10 requests per second, and over it returns HTTP 429. Only HTTP 200 responses count toward weight.
- Don't read direction into IV. A spike says options got more expensive. It does not say the stock will rise or fall.
Next steps
Run the scan once near the open and once near the close, then compare the survivors. Keep a note of why each spike happened so you learn which kinds were worth the attention. This is a research tool, not investment advice.
Claim your free API key and see the Mboum docs for Python, PHP, JavaScript and Bash samples.