A contract trades 20,000 times and the unusual activity page lights up. Was that a wave of new positions, or traders getting out of old ones? Volume alone can't answer it, and it is one of the most common mistakes in reading options data. The answer shows up the next morning in open interest. This guide explains the arithmetic, shows what to compare, and gives you a script that checks it for any contract.
Volume and open interest, defined
- Volume is the number of contracts that traded today.
- Open interest (OI) is the number of contracts that are open: bought or sold and not yet closed.
Open interest updates once a day. On Mboum's Unusual Options Activity page, the Vol/OI column divides today's volume by the open interest that was in place coming into the day. The page states that this ratio does not show whether trades opened or closed positions, or which side bought.
Why the next morning's open interest tells you more
Every contract that trades has a buyer and a seller. For each one, there are three possibilities, and they move open interest differently:
- Both open a new position: open interest rises by 1.
- One opens and one closes: open interest does not change.
- Both close existing positions: open interest falls by 1.
So the change in open interest (ΔOI) for the day sits between minus the volume and plus the volume. Divide it by volume and you get a number between −100% and +100%. This guide calls it the net opening share:
net opening share = (OI after − OI before) ÷ volume
- Near +100%: almost every trade was both sides opening.
- Near 0%: a mix of opening and closing, or traders who bought and sold the same contract within the day. A same-day round trip adds to volume and leaves open interest alone.
- Near −100%: most trades were closing.
The value is a net figure, so it can't separate openings from closings that offset each other. It also doesn't tell you who was the buyer.
Worked example
These are made-up numbers for three contracts.
- Contract A: open interest 1,000 before the session, volume 3,000, open interest 2,500 the next morning. ΔOI is +1,500, so the net opening share is +50%. Volume was triple the old open interest, and half of it turned into new positions.
- Contract B: open interest 5,000, volume 4,000, open interest 3,000 the next morning. ΔOI is −2,000, so the share is −50%. Positions were being closed.
- Contract C: open interest 2,000, volume 10,000, open interest 2,100 the next morning. ΔOI is +100, so the share is +1%. Ten thousand contracts traded and the number open barely moved. Most of that volume offset itself.
Contract C would rank highest on Vol/OI and look the most dramatic, yet it added almost nothing to open positions.
A look at real fields
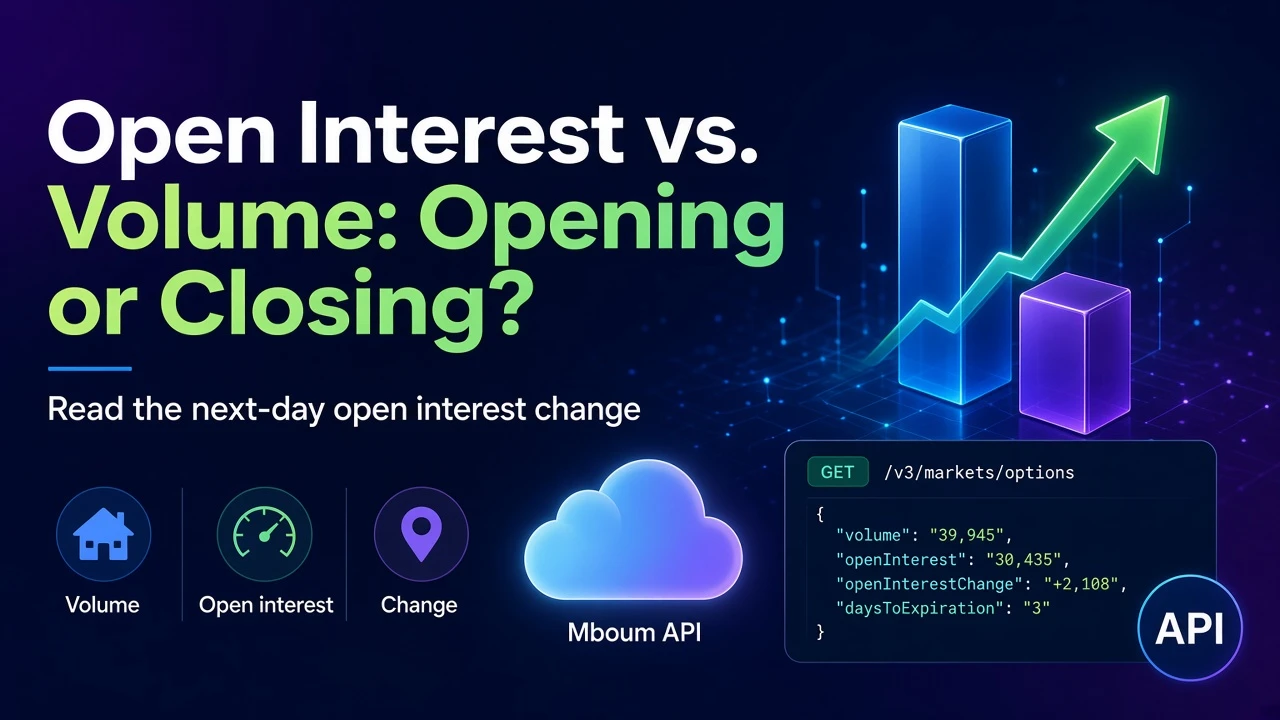
The docs example for the Mboum chain endpoint shows SPY contracts at the $590 strike, expiring 05/30/25:
- Call: volume 39,945, open interest 30,435,
openInterestChange+2,108. That is about 5% of volume. - Put: volume 23,676, open interest 7,496,
openInterestChange−281. That is about −1% of volume.
Read as the same session's change, both contracts traded heavily without moving open interest much. That is the pattern of active, offsetting trading. The docs describe the field only as the change in open interest, and they don't say which two days it spans. The script below computes the change from its own saved snapshots, so you can compare the two.
Get this as JSON
GET https://api.mboum.com/v3/markets/options has weight 2. Send ticker and an expiration in YYYY-MM-DD format. Each contract has symbol, volume, openInterest and openInterestChange. See the endpoint docs.
The workflow has two steps. After the close, run save to store the day's volume and the open interest that was in place coming into the day. The next morning, once open interest has updated, run compare. Use an expiration at least one day out, because contracts that expire today are gone the next morning. Each step costs 2.
import json
import sys
from pathlib import Path

import requests

URL = "https://api.mboum.com/v3/markets/options"
HEADERS = {"Authorization": "Bearer YOUR_MBOUM_API_KEY"}


def num(value):
    return float(str(value).replace(",", "").replace("%", "").replace("+", ""))


def chain_rows(ticker, expiration):
    resp = requests.get(URL, headers=HEADERS,
                        params={"ticker": ticker, "expiration": expiration}, timeout=30)
    data = resp.json()
    body = data.get("body")
    if resp.status_code != 200 or not isinstance(body, dict):
        raise SystemExit(f"No chain: {str(data)[:150]}")
    return {c["symbol"]: c for side in ("Call", "Put") for c in body.get(side, [])}


def save(ticker, expiration):
    rows = chain_rows(ticker, expiration)
    snap = {s: {"volume": num(c["volume"]), "oi": num(c["openInterest"])}
            for s, c in rows.items()}
    Path(f"{ticker}_{expiration}.json").write_text(json.dumps(snap))
    print(f"Saved {len(snap)} contracts")


def compare(ticker, expiration, min_volume=1000):
    saved = json.loads(Path(f"{ticker}_{expiration}.json").read_text())
    now = chain_rows(ticker, expiration)
    if all(num(now[s]["openInterest"]) == old["oi"] for s, old in saved.items() if s in now):
        raise SystemExit("Open interest has not updated yet. Try again later.")
    results = []
    for symbol, old in saved.items():
        if symbol not in now or old["volume"] < min_volume:
            continue
        change = num(now[symbol]["openInterest"]) - old["oi"]
        results.append((symbol, old["volume"], change, change / old["volume"],
                        now[symbol].get("openInterestChange")))
    for symbol, volume, change, share, api_change in sorted(results, key=lambda r: -abs(r[3])):
        print(symbol, f"volume {volume:,.0f}", f"OI change {change:+,.0f}",
              f"net opening share {share:+.0%}", f"API openInterestChange {api_change}")


if __name__ == "__main__":
    action, ticker, expiration = sys.argv[1:4]
    {"save": save, "compare": compare}[action](ticker, expiration)
Run it like this:
python oi_check.py save AAPL 2026-11-20      # after the close
python oi_check.py compare AAPL 2026-11-20   # next morning
The output is sorted by the size of the net opening share, so the contracts where most of the volume opened or closed positions come first.
Sample response
A trimmed call row from the docs example, with the fields the script reads:
{
  "symbol": "SPY|20250530|590.00C",
  "volume": "39,945",
  "openInterest": "30,435",
  "openInterestChange": "+2,108",
  "daysToExpiration": "3"
}
Best practices
- Check the body. A 200 response can carry an error message and no
body. The script exits in that case. - Wait for the update. If the open interest in the second run is identical to the first, the update hasn't happened yet. The script stops and says so.
- Parse the strings. Values such as
"+2,108"and"30,435"need cleaning before you do math. - Respect the rate limit. The limit is 10 requests per second, and over it returns HTTP 429. Only HTTP 200 responses count toward weight.
- Don't read direction into it. A rise in open interest means new positions were opened. It does not say whether buyers or sellers started them, or whether they were bullish.
Next steps
Pick a few contracts that showed up on the unusual activity page, save them after the close, and compare the next morning. After a few weeks you will know how often a high Vol/OI turns into new positions and how often it is just active trading. This is for education, not investment advice.
Claim your free API key and see the Mboum docs for Python, PHP, JavaScript and Bash samples.